How to See Which Dishes Get the Most Views on Your Digital Menu
How to read dish-level view data on your digital menu — correcting position bias, spotting hidden gems, and the testing workflow that turns views into orders.
How to See Which Dishes Get the Most Views on Your Digital Menu
Your best-viewed dish might not be your best dish. It might just be the one at the top of the page.
This is the trap hiding inside dish-level view data, and it's the reason most restaurants misread their own analytics. A dish can be your "best seller" simply because it's visible; another dish may actually be more appealing but sits buried too low in the menu. Guests don't carefully read everything — most scan quickly, compare a few options, and make fast emotional decisions. If nobody opens a dish, it has almost no chance of being ordered.
Seeing which dishes get the most views is technically trivial — your analytics dashboard ranks them in one click. Reading that ranking correctly is the actual skill, and it's what this guide teaches: where the view data comes from, how to separate genuine appeal from mere visibility, and the workflow that turns view insights into measurable order growth.
What "views" actually measure — and the three levels of engagement
Before interpreting anything, be precise about what your platform counts. Dish-level engagement has three distinct levels, and conflating them produces bad decisions:
Level | What the guest did | What it signals |
|---|---|---|
Impression | The dish scrolled past on screen | Visibility only — position in the menu |
View (detail open) | The guest tapped to open the dish's description or photo | Active interest — the dish earned a pause |
Dwell | The guest stayed on the dish detail 20–40 seconds | Serious consideration — something psychological is happening |
The metric worth ranking dishes by is the detail view, not the impression. An impression is a function of where the dish sits; a detail open is a decision the guest made. And dwell time adds a third dimension: if guests spend 20–40 seconds looking at a dish, attention usually means interest — and when they still don't order it, that gap is the most valuable diagnostic signal your menu produces.
Every scan is a page load, every category scroll a measurable event, every tap a data point — real numbers for every dish: views, scrolls, taps, dwell time, order conversion. For most restaurants, this is the first dataset they have ever had about what diners actually do rather than what they end up buying.
Step 1 — Pull the ranking, but read it against position
Open your analytics dashboard and sort items by detail views over the last 30 days. Before drawing any conclusion, overlay one piece of context: where each dish sits in the menu.
The reason is position bias, and it is not subtle. Korean behavioural research found that approximately one-third of diners order the very first item they see in a category — the first entrée listed has a 33% chance of being selected, regardless of price or description. On mobile, this first-item bias is even stronger, because scrolling requires active effort that many guests avoid. The same pattern is documented far beyond restaurants: eye-tracking studies show users focus overwhelmingly on the first few entries of any vertical list, with 65% engaging in a depth-first manner — tapping the first item that seems relevant without evaluating the full list.
The practical consequence: raw view counts systematically flatter whatever is at the top and bury whatever is at the bottom. To read your ranking honestly, group dishes by menu position before comparing:
A top-position dish with high views — expected; the position is doing at least part of the work
A top-position dish with low views — a genuine red flag; even placement can't generate interest
A bottom-position dish with high views — a strong signal; guests are actively seeking this dish out despite the friction
A bottom-position dish with low views — unknown; the dish never got a fair chance to be judged
That last category is the most misunderstood. A dish with few views isn't necessarily unappealing — it may simply be invisible. Which is exactly why the fix for low views is a position test, not a deletion.
Step 2 — Cross views with orders: the four dish profiles
View data alone tells you what attracts attention. Crossed with your sales data, it tells you what converts — and every dish lands in one of four profiles:
Profile | Views | Orders | Diagnosis | Action |
|---|---|---|---|---|
Stars | High | High | Attracts and converts | Protect their position; feature them |
Curiosities | High | Low | Attracts, then something blocks | Fix description, photo, or price |
Hidden gems | Low | High | Converts brilliantly when discovered | Promote upward — highest-ROI move available |
Dead weight | Low | Low | Neither seen nor missed | Position-test once, then remove or rework |
Two of these profiles deserve special attention because they're where the money is.
Curiosities are the fixable losses. The dish earns the tap — the name or photo works — and then loses the guest at the decision point. The blocker is almost always one of three things: a description that doesn't sell (generic rather than sensory), a photo problem (missing, or worse, unappetising), or a price that reads wrong against its section neighbours. In practice, most restaurants discover around three items underperforming despite high views, and it's usually a photography or description problem.
Hidden gems are the free wins. These dishes convert at a high rate whenever guests find them — they're simply buried. The same platform data shows most restaurants also find about two unsung items quietly converting at high rates, worth promoting to the top of their section. Moving a hidden gem from position six to position one costs nothing on a digital menu and can multiply its exposure overnight — remember that a third of guests order the first item they see.
Step 3 — Run the position test before trusting any conclusion
Here is the discipline that separates data-driven menu management from dashboard-watching: when a dish's view count surprises you — high or low — test position before concluding anything about the dish itself.
The protocol is simple and borrowed directly from e-commerce, where position bias correction is standard practice:
Pick one dish whose views don't match your expectation (usually a suspected hidden gem or a low-view dish you believe in)
Move it to first position in its category — nothing else changes: same name, same photo, same price, same description
Wait two weeks — enough covers to smooth out daily noise
Compare views and orders against the prior two-week period
If views jump and orders follow proportionally, the dish was position-starved — it's a hidden gem, and it stays up. If views jump but orders don't move, you've just converted a mystery into a Curiosity: the dish now gets seen and still doesn't convert, so the blocker is in the presentation, and you know exactly what to work on next.
One variable at a time is the whole game. Many menu decisions are made on assumptions — someone updates three things at once, sales move, and nobody knows why. Was it the position? The wording? The photo? Single-variable changes with a fixed measurement window are what make your view data trustworthy. This is exactly how e-commerce companies optimise online stores; restaurants are finally starting to do the same.
Step 4 — Use view patterns beyond individual dishes
Once you're reading dish-level views correctly, three aggregate patterns add further value:
Category attention share. Sum the views per category and compare against the category's share of menu items. A section drawing 30% of views with 15% of items is over-performing — worth expanding or investing in better photos. Knowing which sections get the most traffic tells you where to invest in new dishes. A section drawing views far below its item share is either misnamed, badly positioned, or genuinely uninteresting to your guests.
View timing by daypart. If certain dishes spike in views at lunch but convert at dinner, guests are browsing ahead — researching before a later visit. That's a signal for a lunch-visible dinner promotion, and further evidence that the entrance-window QR code and pre-visit browsing matter.
New-item visibility check. Every new dish you launch should get a view-count check after week one. If a new special shows minimal views, the problem isn't the dish — nobody has seen it yet. Check its position, its photo, and whether your seasonal section actually sits at the top of the menu. Without this check, you can't tell whether a new item failed on merit or never got seen — a distinction paper menus could never reveal.
What this looks like on PixPlat
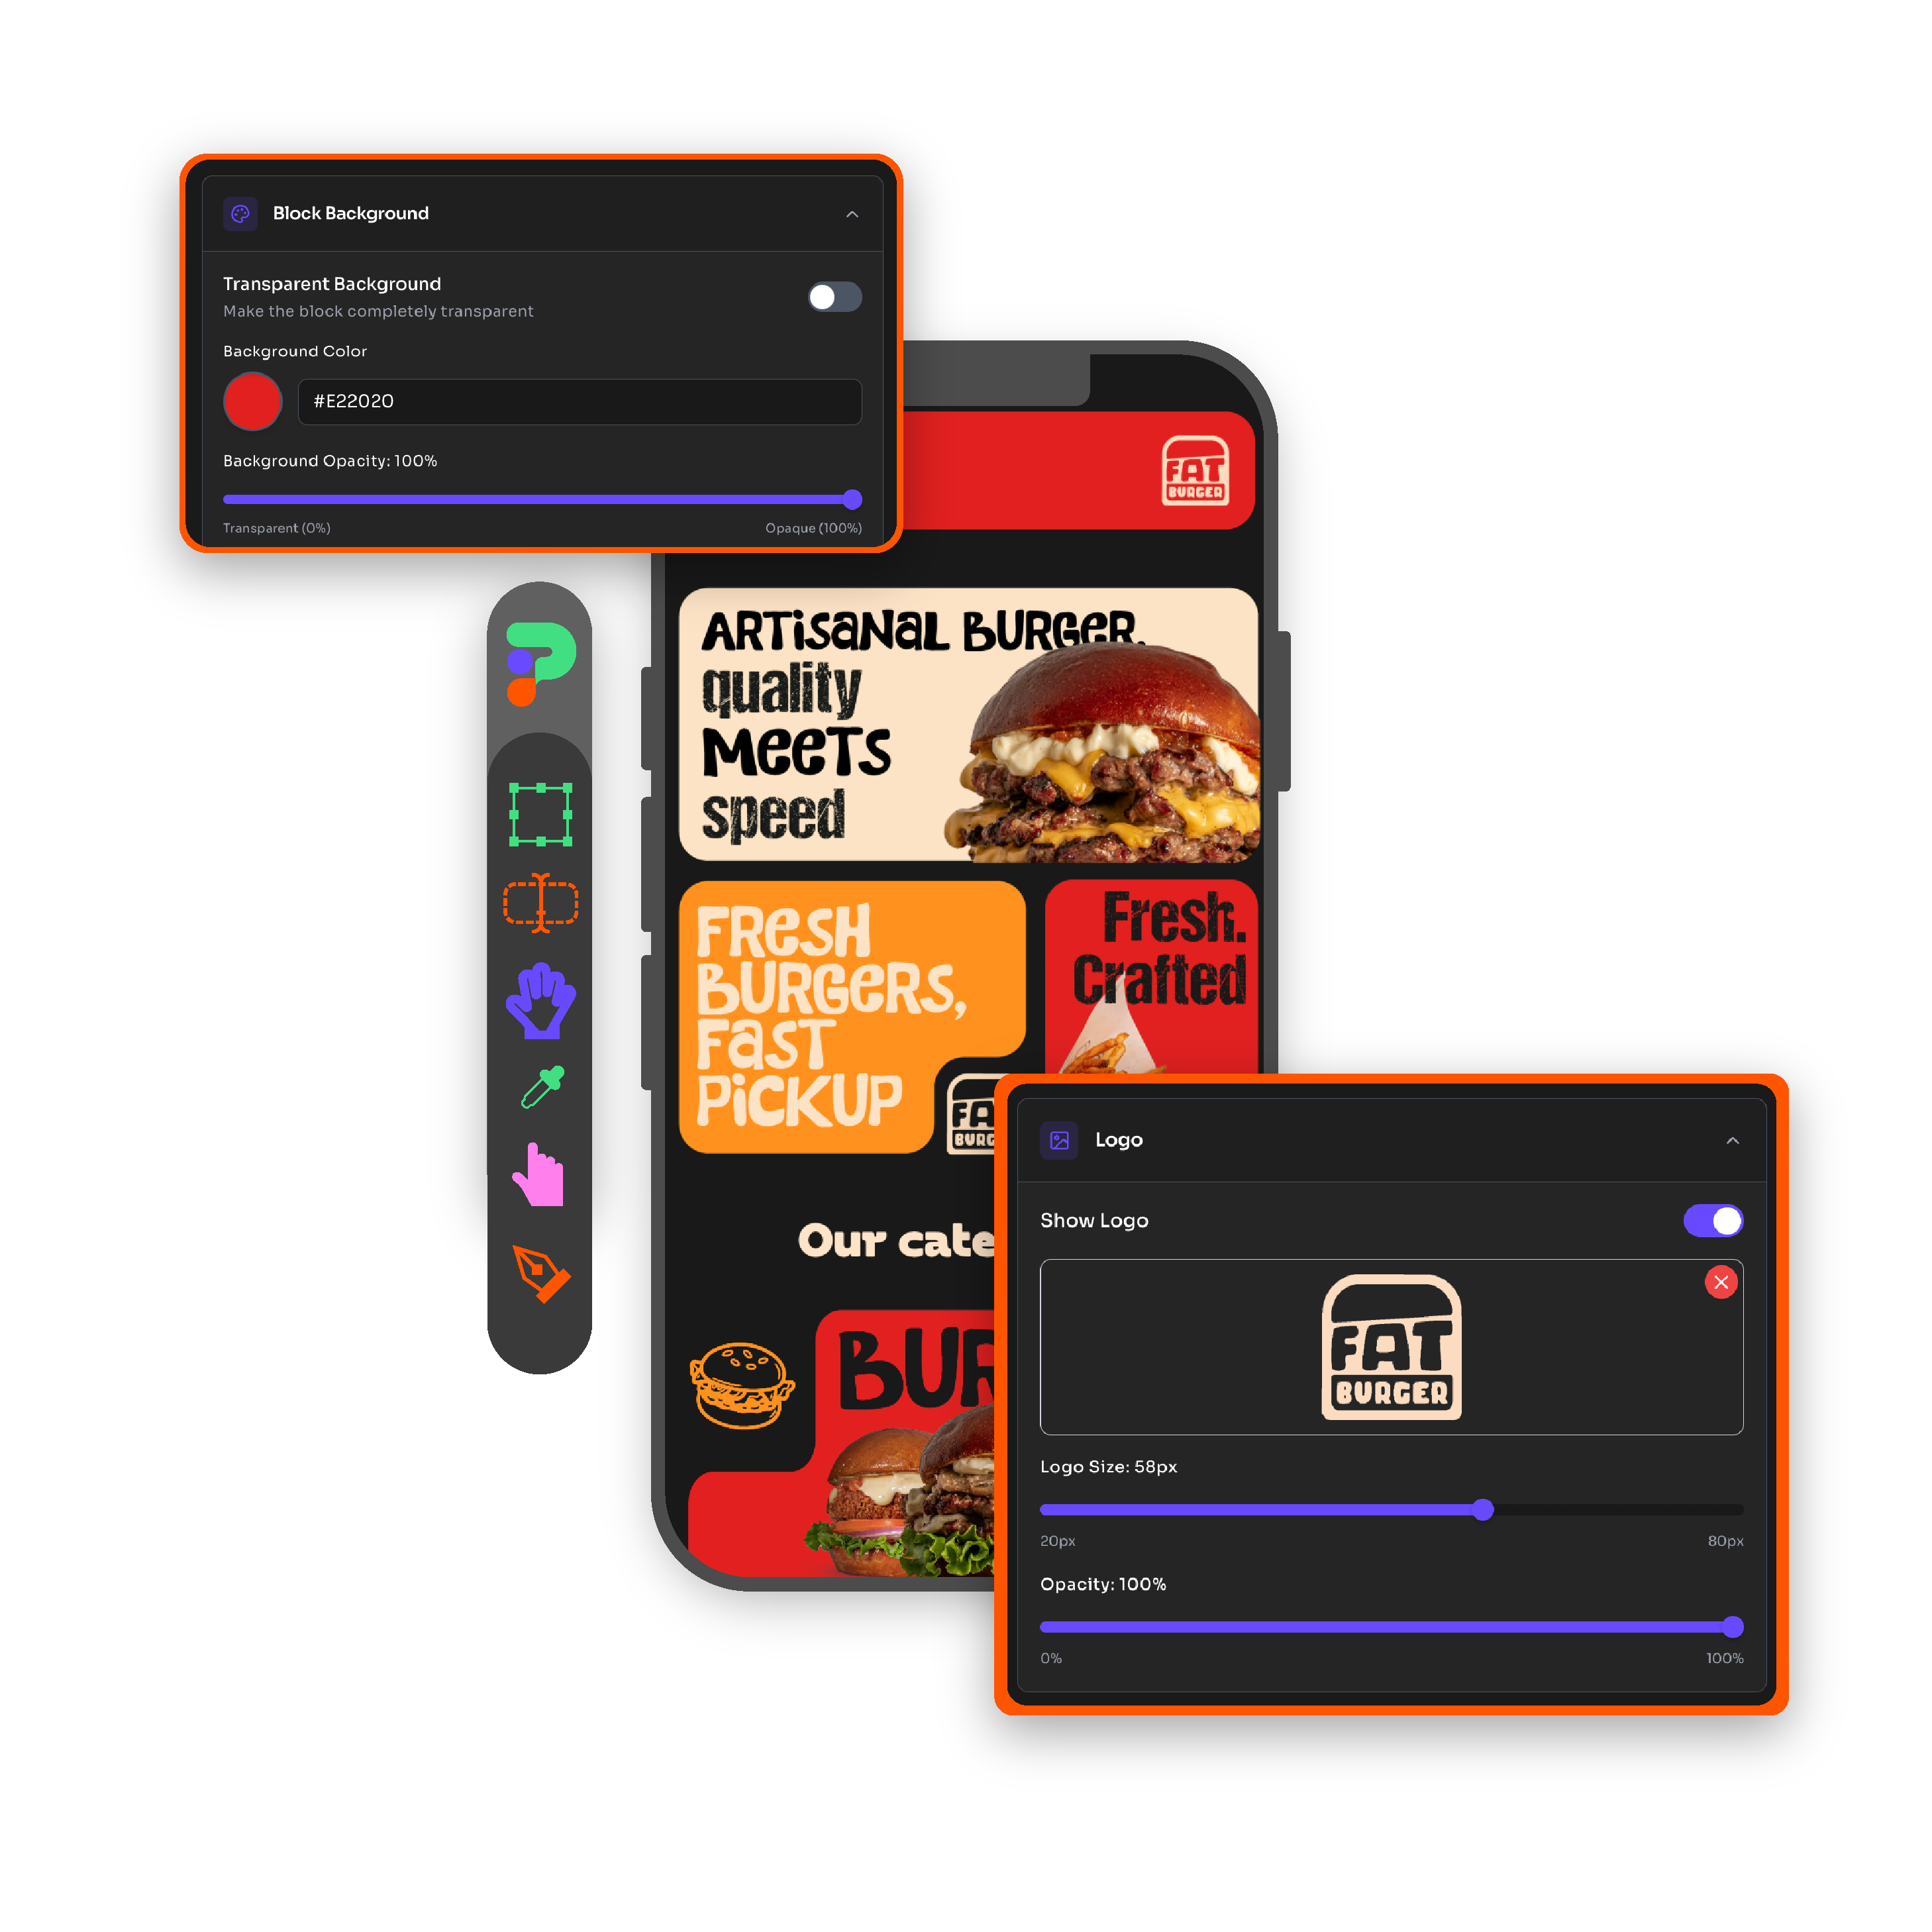
PixPlat's dashboard ranks item-level views out of the box, with the trend per dish over time rather than raw lifetime counters — so a repositioning test reads as a visible before/after on the same chart. Views are broken down per category, and because each QR code reports separately, you can even see whether bar guests and dining-room guests browse different dishes.
The loop from insight to action stays inside one tool: spot the Curiosity in the analytics view, open the item in the editor, rewrite the description or swap the photo, and the fix is live before the next service. Reposition a hidden gem by dragging it to the top of its section — no republishing, no new QR code, and next week's view data tells you whether it worked.
→ For the full metric taxonomy and alert thresholds, see Which metrics to track to improve your digital menu performance
→ For the analytics framework and weekly review practice, see Restaurant menu analytics: understanding your customers
→ For applying menu changes in real time, see Restaurant menu management: updating your menu in real time
→ For the complete digital menu strategy, see The complete guide to digital menus for restaurants
Frequently asked questions
Why do my top-of-menu dishes always have the most views?
Because position drives attention more than appeal does. Roughly a third of diners order the first item they see in a category, and on mobile the effect is stronger because scrolling takes effort. High views on a top-position dish tell you little about the dish itself — the honest comparison is between dishes at similar positions, or through a position test: move a lower dish to the top for two weeks and see whether it matches the incumbent's numbers.
A dish gets lots of views but few orders. Should I remove it?
No — that profile (a "Curiosity") is the most fixable situation in menu analytics. The views prove the dish attracts genuine interest; the missing orders prove something blocks the decision. Work through the three usual blockers in order: rewrite the description with specific sensory language, add or improve the photo, and check the price against its section neighbours. Change one thing, measure for two weeks. Removal is for dishes that fail after the presentation has been fixed — not before.
How long should I collect view data before making decisions?
Thirty days gives you a reliable dish-level ranking for a typical restaurant's traffic; two weeks is the minimum window for measuring any single change. Daily numbers are noise — one busy Saturday or a single large party can distort a dish's daily views completely. Judge trends across weeks, and always compare like periods (this fortnight versus the previous fortnight, not versus a holiday week).
Can I see which dishes guests look at but my POS says never sell?
Yes — that's precisely the gap dish-level view data was built to close. Your POS only records outcomes; the menu records consideration. Dishes with substantial views and near-zero sales are invisible in POS reports (they just look like non-sellers), but the view data reveals they're attracting real attention and failing at the conversion moment — a presentation problem with a clear fix, not a demand problem.